



Most gym owners track everything except what actually matters. They'll tell you their Instagram follower count, how many people came in yesterday, maybe class attendance rates. But ask about member lifetime value by acquisition channel? Blank stares. Month-three retention rates across membership tiers? Nothing.
The problem isn't lack of data. Modern gym management platforms generate mountains of metrics. The problem is gym owners get buried under operational noise while missing the signals that actually predict whether they'll be in business next year.
After building operational dashboards for gyms ranging from boutique studios to multi-location chains, the same pattern keeps showing up: successful gyms follow a strict metrics hierarchy that filters noise from signal. Revenue drivers first, retention indicators second, engagement metrics third. Everything else is operational detail.
This hierarchy isn't just organizational preference. It reflects how gym economics actually work. A gym with strong revenue per member and solid retention can survive mediocre engagement metrics. But perfect class attendance means nothing if members churn after two months and you're bleeding cash on customer acquisition.
Revenue metrics: what keeps the lights on
Revenue sits at the top of your gym KPIs dashboard because without it, nothing else matters. But raw monthly revenue tells you almost nothing useful on its own. You need to break it down into components that reveal what's actually happening operationally.
Start with average revenue per member (ARM). Not your headline membership rate — actual collected revenue divided by active members. If your base membership is $149 but your ARM is $122, you've got a collections problem or excessive discounting happening somewhere. Track ARM by cohort too. Members who joined six months ago should show different ARM patterns than people who joined last week.
Then look at revenue concentration risk. What percentage of revenue comes from your top 20% of members? If it's over 40%, you're exposed. One bad month of high-value member churn can crater finances fast. Personal training revenue is especially prone to concentration issues.
Membership revenue predictability matters more than most owners realize. Calculate your forward-looking contracted revenue for the next 90 days based on current memberships. Subtract expected churn based on historical rates. That gives you actual revenue visibility, not wishful thinking.
Non-dues revenue needs its own tracking. Break it down by category — personal training, small group training, retail, other services — but what really matters is contribution margin by category. That $50 shake at the juice bar might generate less profit than a $20 resistance band once you factor in inventory, spoilage, and labor.
Track new member acquisition cost (CAC) by segment. Facebook ad CAC will differ wildly from referral CAC. Your front desk conversion rate affects everything downstream. If you're spending $50 per lead but converting at 20%, your effective CAC is $250. Push conversion to 35% and CAC drops to $143 without spending another dollar on marketing.
A revenue dashboard that actually drives decisions looks something like this:
Daily Revenue Snapshot
-
Yesterday's collected revenue
$3,847
-
Monthly run rate (yesterday × 30)
$115,410
-
Variance from 30-day average
+$234
-
New joins revenue
$447
-
Recurring billing collected
$2,890
-
Non-dues revenue
$510
Weekly Revenue Analysis
-
7-day revenue
$24,332
-
Same week last month
$22,108
-
YoY same week
$19,445
-
CAC by channel (7-day average)
-
Conversion rate by source
varies 18-44%
-
Paid ads
$187
-
Referrals
$32
-
Walk-ins
$67
Monthly Revenue Breakdown
-
MRR
$89,234
-
Forward 90-day contracted
$257,320
-
Expected churn impact
-$34,200
-
Revenue per square foot
$14.20
-
Revenue per staff hour
$127
None of these are vanity metrics. Each one ties directly to an operational decision. Low revenue per square foot means you need to optimize space usage or cut rent burden. Declining forward contracted revenue signals you need to boost sales efforts now, not when cash flow actually tightens.
Retention: the metric that multiplies everything
Retention determines whether your gym is a sustainable business or an expensive member acquisition hamster wheel. Yet most gyms track only crude monthly churn rate, missing the nuanced patterns that actually predict member behavior.
End appointment chaos and boost attendance.
Gymioly streamlines booking, confirms sessions, and manages memberships effortlessly.
- Unified class and membership management
- Automated member notifications
- Trainer scheduling and availability
No credit card required
Cohort retention tells the real story. Members who join in January behave differently than July joiners. Track retention curves by join month, membership type, and acquisition source. You'll find referral members showing 85% six-month retention while Facebook ad members sit around 52%.
The critical retention windows cluster around specific timeframes. Month one is about activation — did they actually start using the gym? Month three is habit formation. Month six is lifestyle integration. Month twelve is community connection. Different interventions work at each stage.
Your retention dashboard needs granular segmentation:
30-Day Retention Indicators
-
New member first-week visit rate
73%
-
Activation rate (3+ visits in first 14 days)
61%
-
Early warning flags triggered
47 members
-
Intervention success rate
34%
90-Day Retention Tracking
-
Month 3 retention by tier
-
Freeze requests
23
-
Downgrade requests
8
-
Successful saves
14
-
Premium unlimited
78%
-
Basic membership
64%
-
Class-only
71%
Annual Retention Patterns
-
12-month retention rate
67%
-
24-month retention rate
43%
-
Average member lifetime
18.3 months
-
LTV by acquisition channel
$1,247-$2,890
Retention metrics without action triggers are worthless though. Build decision rules directly into your tracking:
If week-one activation rate drops below 70%, immediately audit your onboarding process. Are front desk staff scheduling initial sessions? Are welcome emails actually going out? Are new member orientations happening?
When month-three retention for any cohort falls below 60%, trigger a cohort-specific intervention within 72 hours. February joiners may need different messaging than September joiners. Your Tuesday evening crowd might have different retention patterns than morning members.
Payment failure deserves its own workflow. First failure: automated retry in 3 days. Second failure: personal text from a manager. Third failure: phone call with a save offer. Track save rates at each intervention point. Most gyms lose 30% of failed payments unnecessarily just through poor follow-up.
Pre-churn signals hide in usage patterns. Members who reduce visit frequency by 50% over two weeks rarely come back without some kind of outreach. Members who stop attending their regular class for three sessions in a row need contact. The member switching from consistent evenings to sporadic afternoon visits is usually planning their exit.
Engagement: leading indicators of retention
Engagement metrics predict retention but don't directly drive revenue. That's why they sit third in the hierarchy. Perfect engagement with poor monetization still equals bankruptcy.
Visit frequency forms your engagement foundation, but raw visit counts mislead. A member who shows up daily for two weeks then vanishes is less valuable than someone with steady twice-weekly attendance for months. Track visit consistency, not just volume.
Class Performance Matrix
| Metric | Value |
|---|---|
| Average capacity utilization | 67% |
| Peak class waitlist depth | 8-12 people |
| No-show rate by time slot | 8-31% |
| Instructor impact on attendance | +/- 23% |
| Cost per attended class slot | $3.47 |
The insights come from cross-referencing. That 6am spin class with 95% utilization but 31% no-shows needs a completely different intervention than the 4pm yoga with 45% utilization and zero no-shows. The first needs no-show policy enforcement. The second needs schedule optimization.
Member engagement scoring helps identify who needs attention before they churn. A simple model works fine:
-
Visit frequency (40% weight)
-
Visit consistency (30% weight)
-
Service diversity (15% weight)
-
Social connections (15% weight)
Members scoring below 50 need immediate intervention. Those scoring 50-70 need monitoring. Above 70 are your stable base.
Community engagement matters but resists easy quantification. Track proxy metrics instead:
-
Member-to-member referrals
-
Social media tags and check-ins
-
Event participation rates
-
Average members per group class booking
-
Guest pass usage patterns
PT and small group training engagement requires separate tracking:
Personal Training Engagement
-
Sessions completed per package
87%
-
Package renewal rate
64%
-
Average sessions per week per client
1.7
-
Trainer utilization rate
72%
-
Revenue per training hour
$67
Low package completion predicts non-renewal. High trainer utilization with low revenue per hour usually means a pricing problem.
Review cadences that actually drive action
Metrics without review cadences are expensive decoration. Most gyms either never look at their data or drown in daily reports that obscure what's actually changing.
Daily metrics need tight focus. Revenue collected, new joins, cancellations, critical operational alerts. Five minutes each morning. You're looking for anomalies, not trends.
Weekly reviews compare performance to recent baselines. Pull your trailing four-week average for key metrics. Is this week meaningfully different? If retention dropped 5% week-over-week, investigate. If it fluctuated 1%, that's noise.
Monthly reviews drive strategic decisions. This is where you analyze cohort performance, review retention curves, evaluate marketing channel ROI, and plan interventions. Block three hours for a real monthly review — not a quick skim. Include department heads who own specific metrics.
Quarterly reviews zoom out to see strategic patterns. Are your fundamental unit economics improving? Is customer lifetime value trending up? Are operational costs scaling properly with revenue?
A realistic review schedule:
-
Daily (5 minutes at opening)
Revenue dashboard check; New joins and cancellations; Operational alerts review; Quick win/concern for team huddle
-
Weekly (30 minutes Monday morning)
Week-over-week performance; Cohort check-in for at-risk segments; Marketing funnel metrics; Upcoming week's targets
-
Monthly (3 hours first Tuesday)
Full retention analysis; Revenue breakdown by segment; Engagement score distribution; Department metric ownership review; Intervention planning
-
Quarterly (Half day)
Unit economics deep dive; Competitive positioning analysis; Annual projection adjustments; Strategic initiative ROI review
Here's a simple workflow visualization of the review cadence.
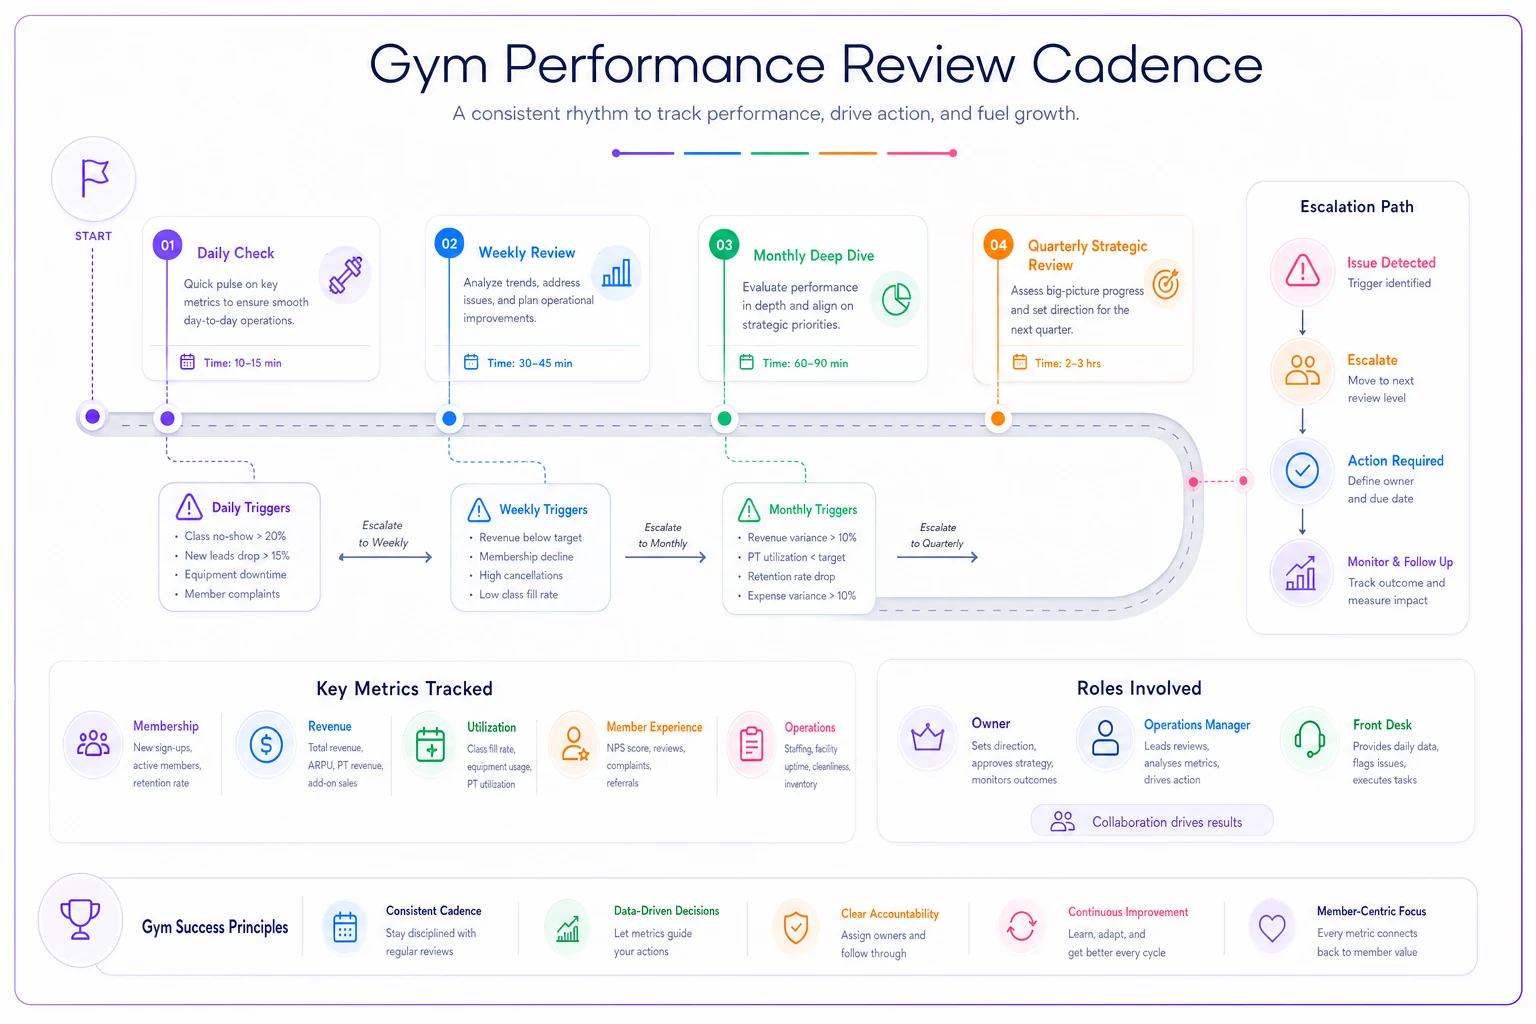
Daily metrics are anomaly detectors. Weekly digs into short-term changes. Monthly drives strategic shifts. Quarterly confirms whether those shifts are moving unit economics.
Decision rules that turn numbers into operations
Metrics without decision rules create analysis paralysis. You need explicit triggers that convert data into action — not suggestions or guidelines, but firm rules that trigger specific responses.
Start with revenue protection rules:
When daily revenue drops 20% below the trailing 30-day average for three consecutive days, trigger an immediate review of billing systems, payment processing, and front desk operations. This catches technical issues before they become cash flow problems.
If monthly ARM drops more than 5%, audit your discounting practices right away. Either someone's giving away too many deals or you have a collections problem building.
When CAC exceeds 35% of six-month lifetime value for any channel, pause that marketing spend. Don't wait for the monthly review — investigate immediately.
Retention triggers need faster response times:
New member no-show for the first week requires a text message by day 8, phone call by day 10, and manager intervention by day 14. No exceptions.
When any cohort's month-three retention drops below 65%, launch a cohort-specific re-engagement campaign within 72 hours. Generic "we miss you" emails don't count. The intervention needs to be targeted based on that cohort's characteristics.
If rolling 30-day churn rate exceeds 7%, implement a membership freeze for all discretionary cancellations while you diagnose the cause. Better to pause than permanently lose members you could have saved.
Engagement thresholds trigger operational changes:
Class utilization below 40% for four consecutive sessions means a schedule change or instructor review. Below 25% for two weeks means immediate cancellation.
When member engagement scores drop 20 points in two weeks, trigger personal outreach within 48 hours. Not an automated email — actual human contact from someone they know.
If PT package completion drops below 80%, revise package structure and expiration policies. Members not using what they've bought predicts future purchase resistance.
Building dashboards that people actually use
The best gym KPIs dashboard is the one your team actually checks. Sophisticated analytics platforms mean nothing if managers won't log in.
Keep visualizations simple. Traffic lights (red/yellow/green) beat complex charts. Trend arrows matter more than precise percentages. If someone needs a statistics background to interpret the dashboard, you've already failed.
Layer information by role. Front desk sees daily joins, conversion rates, and tour scheduling. Trainers see their utilization, client retention, and package completion. Managers see everything, with role-specific views for quick checks.
Mobile optimization isn't optional. Your Saturday manager checking metrics from their phone needs the same decision-making capability as someone at a desktop. If they can't access critical metrics during a busy weekend shift, those metrics effectively don't exist.
Most importantly, integrate action triggers directly into dashboards. Don't just show that retention is declining — display the specific members who need outreach, with their contact information and suggested scripts. Turn data into immediate action.
A functional dashboard architecture:
| View | Contents |
|---|---|
| Owner/GM View | Revenue health score (0-100); Retention risk indicators; Cash flow projection; Department performance summary; Critical alerts requiring decision |
| Operations Manager View | Daily operational metrics; Staff performance indicators; Facility utilization patterns; Member issue queue; Maintenance scheduling alerts |
| Front Desk View | Today's appointments and tours; Conversion rate (personal and team); New member activation checklist; Follow-up task queue; Real-time capacity status |
Put the member save workflow directly on the front desk dashboard so follow-ups happen in the moment.
AI-powered operational software makes this kind of systematic approach realistic without massive manual effort. Instead of spending hours compiling reports, AI automation can continuously monitor your metrics hierarchy, flag anomalies before they become problems, and surface intervention suggestions based on what's worked historically. The platforms that work best don't replace human judgment — they make sure the right information reaches the right person at the right time, while automating the routine analysis that would otherwise eat an owner's entire morning.
Escaping the metrics trap
The paradox of metrics is that the more you can measure, the less clear your priorities become. Modern gym software can track thousands of data points, but successful gyms focus on maybe a dozen that actually matter.
The hierarchy — revenue, then retention, then engagement — isn't just an organizing principle. It's an operational philosophy that says financial sustainability enables everything else. You can't help members hit their fitness goals if you can't pay rent.
Within that hierarchy, the specific metrics that matter depend on your gym's model and where you are in the business. A boutique studio with premium pricing needs different triggers than a high-volume, low-price facility. A gym in growth mode watches different indicators than one optimizing for profitability.
The gyms that thrive make measurement discipline part of their culture. Every team member knows their number. Every meeting starts with a metrics check. Every decision ties back to something measurable.
More importantly, they treat their metrics as a system, not isolated readings. When engagement drops, they know retention will follow in 60 to 90 days. When retention weakens, they can calculate the revenue impact six months out. That kind of systematic view is what separates reactive firefighting from proactive management.
The technology to automate most of this analysis exists today. But technology without the right hierarchy, cadences, and decision rules just generates more noise. Start with the framework. Then let operational software handle the heavy lifting of data collection, analysis, and alerting.
Your gym's future isn't determined by how much data you collect. It's determined by how quickly you turn the right signals into the right actions.
The technology to automate most of this analysis exists today. But technology without the right hierarchy, cadences, and decision rules just generates more noise. Start with the framework. Then let operational software handle the heavy lifting of data collection, analysis, and alerting.
Your gym's future isn't determined by how much data you collect. It's determined by how quickly you turn the right signals into the right actions.
Ready to elevate your gym operations?
Join 2,000+ gyms using Gymioly to reduce admin overhead, improve member experience, and grow revenue.