


Most gym owners hit the same wall with benchmarking: they read that a "good" gym does $X per square foot, or that member retention "should" sit at 71%, and then they either panic or feel great — both for the wrong reasons. The number they're comparing against came from a business that looks nothing like theirs. A 24-hour access box in a strip mall and a boutique HIIT studio with two trainers on the floor at all times are not the same species, but they get lumped into the same average constantly.
The real problem isn't a shortage of benchmarks. It's that raw benchmarks are almost useless until you normalize them — adjust the numbers so they account for how big your space is, how many trainers you run, and how many members you actually serve. Without normalization, you're comparing a number that includes a variable you don't share. This piece is about how to fix that: what to normalize per-door, per-trainer, and per-member, who you should actually be comparing against, and how to build a workbook that produces realistic targets instead of aspirational fantasies.
Why raw benchmarks quietly lie to you
An owner sees "top gyms retain 80% of members annually" and decides their 68% is a disaster. But that 80% figure came from a blend of contract-heavy big-box chains with 12-month lock-ins and boutique studios that churn but replace fast. Neither describes a month-to-month neighborhood strength gym. The owner spends three months chasing a retention number that was never realistic for their model, and ignores the fact that their per-member profitability is actually strong.
The deeper issue is that gyms differ on at least three axes at the same time:
-
Footprint — a 2,000 sq ft studio and a 14,000 sq ft facility have completely different cost structures and revenue ceilings.
-
Labor model — trainer-heavy operations carry payroll that access-only gyms don't, but they also monetize hours the access gym never touches.
-
Member base size and mix — 300 high-touch members behave nothing like 2,400 low-touch members.
When you compare a single raw number across two gyms that differ on all three axes, you're not learning anything. You're generating anxiety or false confidence. Normalization is the step that strips out the variable you don't share so you can compare the thing you actually care about.
The three normalization lenses that matter
Almost every meaningful gym metric should run through one of three denominators before you compare it to anyone else. Which denominator you pick depends on what decision you're trying to make.
End appointment chaos and boost attendance.
Gymioly streamlines booking, confirms sessions, and manages memberships effortlessly.
- Unified class and membership management
- Automated member notifications
- Trainer scheduling and availability
No credit card required
Per-door (per square foot / per facility)
This is your real-estate and capacity lens. Rent, utilities, equipment density, and total revenue capacity all scale with space. Per-door normalization answers: am I getting enough out of the box I'm paying for?
The classic version is revenue per square foot, but don't stop there. Look at:
-
Revenue per square foot (monthly and annualized)
-
Members per usable square foot (excludes offices, storage, hallways)
-
Occupancy cost as a % of revenue (rent + utilities + CAM)
A common mistake here is using total square footage instead of usable floor space. A gym with 3,000 sq ft of mechanical rooms, oversized locker areas, and a giant unused mezzanine looks efficient on paper and terrible in reality. Measure what members can actually train in.
Per-trainer (per labor unit)
This lens is about whether your people are producing. It matters enormously for boutique and PT-heavy models and barely at all for pure access gyms. Per-trainer normalization answers: is each coach generating enough to justify their loaded cost?
Useful per-trainer numbers:
-
Revenue generated per trainer per month (sessions + attributed memberships)
-
Billable-hour utilization (billable hours ÷ scheduled hours)
-
Sessions delivered vs. sessions sold (a proxy for reschedule/no-show leakage)
The thing that breaks first in real operations is scheduled but unbilled time. A trainer paid for 30 floor hours who only delivers 14 billable sessions is a per-trainer efficiency problem, not a demand problem — and you'll never see it in gross revenue.
Per-member (per unit of demand)
This is your economics lens, and it's the one most owners under-use. Per-member normalization strips out how big you are so you can see how healthy each relationship is. It answers: is each member relationship actually profitable and sticky?
Core per-member figures:
-
Average revenue per member per month (ARM), including non-dues
-
Contribution margin per member
-
Ancillary (non-dues) revenue per member
-
Cost to serve per member
If you want to go deeper on the non-dues side of per-member economics, the breakdown in our post on validating non-dues revenue with unit-economics micro-models pairs directly with this — because per-member ancillary revenue is where a lot of small gyms quietly win or lose against comparators.
How the three lenses connect (and where they conflict)
The lenses aren't independent — and watching how they interact is where benchmarking stops being a report card and starts being an operating tool.
Picture a studio that looks fantastic per-door: revenue per square foot well above its comparator set. Feels like a win. But run the per-trainer lens and you find utilization is low — they're winning on space efficiency purely because they crammed in members and are underusing their coaches. That's a fragile position. The moment a competitor opens nearby and pulls 15% of members, the per-door number collapses because there was no per-trainer productivity holding it up.
The reverse also happens. A gym with mediocre revenue per square foot but excellent per-member contribution margin is often in a stronger long-term position than a packed box with thin margins. They have room to grow into their space without adding cost.
The workflow to actually use this:
-
Calculate all three lenses for the same period.
-
Flag any lens that sits more than ~15% off your comparator target.
-
When two lenses disagree, trust the per-member lens for profitability decisions and the per-door lens for expansion/lease decisions.
-
Only then look at raw totals — as context, not as the headline.
This ordering matters. Owners who lead with raw revenue almost always misdiagnose. Owners who lead with normalized lenses catch the real bottleneck.
Here's a quick visual of that workflow.
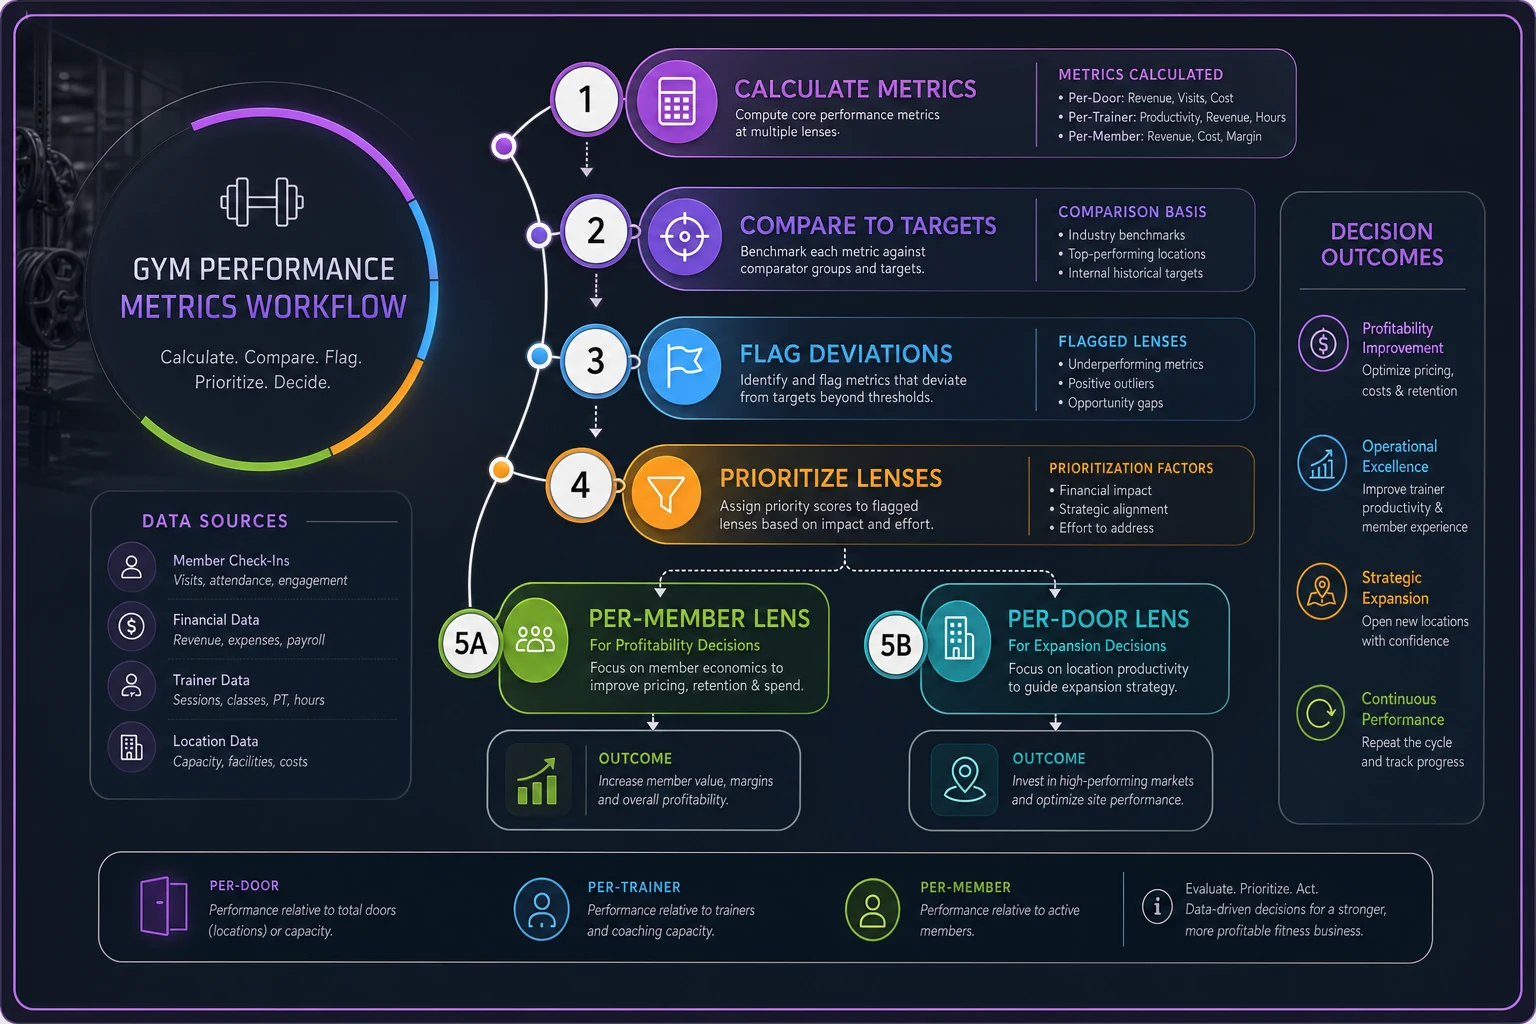
Owners who lead with raw revenue almost always misdiagnose. Owners who lead with normalized lenses catch the real bottleneck.
Choosing a comparator set that isn't garbage
A benchmark is only as good as the group you're comparing against. The single biggest mistake is comparing against "the industry" when the industry is a blend of five business models. Build a comparator set of gyms that share your model, not your logo.
| Model | Typical footprint | Labor intensity | Lead normalization lens | Bad comparator to avoid |
|---|---|---|---|---|
| Boutique studio (HIIT/cycle/pilates) | 1,500–3,500 sq ft | High (coach on floor) | Per-trainer + per-member | Big-box access gyms |
| 24/7 access gym | 4,000–12,000 sq ft | Low | Per-door + per-member | Boutique studios |
| Strength / performance gym | 3,000–8,000 sq ft | Medium | Per-member + per-trainer | Franchise cardio clubs |
| Hybrid (access + classes + PT) | 6,000–15,000 sq ft | Medium-high | All three, weighted | Single-service studios |
| Small-group PT studio | 800–2,500 sq ft | Very high | Per-trainer | Any low-touch model |
To build your comparator set:
-
Match on 2 of 3 axes minimum — footprint band, labor model, and member-base size. Matching on all three is ideal but rare.
-
Match market density. A gym in a dense urban core with high rent and high foot traffic isn't comparable to a suburban gym with cheap rent, even at the same square footage.
-
Aim for 5–9 comparators. Fewer than five and one outlier skews everything. More than nine and you're back to blended-average mush.
-
Refresh yearly. Comparators open, close, and reposition. A set from three years ago is stale.
If you can't find enough peer gyms with shared data, use published segment reports but only for gyms in your model band, and treat those as a wide range rather than a precise target.
When national benchmarks are actually fine
There's a place for broad industry numbers: directional trends. Is per-member ancillary revenue rising sector-wide? Are labor costs climbing across the board? For that, blended data is useful. Just don't set specific operational targets from it.
When they're a bad idea
Never set your retention target, your revenue-per-square-foot goal, or your trainer utilization target off a national blended average. Those are exactly the numbers most distorted by model mix. And if you're a small-group PT studio, most public "gym" data actively misleads you — your economics look nothing like the average facility in those datasets.
Building the benchmarking workbook
The workbook is where this becomes repeatable instead of a one-time spreadsheet you never open again. Structure it in four tabs.
Tab 1 — Raw inputs. Pull the actual monthly numbers: total revenue, dues revenue, non-dues revenue, total members, active members, trainer count, scheduled trainer hours, billable trainer hours, usable square footage, occupancy cost. Nothing calculated here — just source data.
Tab 2 — Normalized outputs. This tab does the division. Every raw input gets converted into its per-door, per-trainer, or per-member form automatically. The point is to never eyeball these by hand — math errors on normalization are where a lot of bad decisions start.
Tab 3 — Comparator targets. Your peer set's ranges, entered as low/mid/high per metric. Not single numbers — ranges. A target of "$28–$34 revenue per square foot" is honest; "$31.50" pretends to a precision that doesn't exist.
Tab 4 — Variance dashboard. This flags where you sit versus target: green inside range, yellow within ~15%, red beyond that. This is the tab you actually look at monthly.
A quick note on data hygiene: the workbook is only as good as what feeds it. If your active-member count, billable hours, and non-dues revenue live in three disconnected systems and get keyed in by hand each month, you'll get inconsistent inputs and stop trusting the output within a couple of quarters. Gyms that keep benchmarking alive tend to pull these figures from a single operational platform where membership, scheduling, and POS data already live together — so the raw-inputs tab populates from real records instead of memory and manual exports. The tooling matters less than the principle: normalized benchmarking dies the moment the inputs become a monthly chore.
Pull raw inputs from a single operational platform so the raw-inputs tab populates from real records instead of memory and manual exports.
For the cadence and dashboard discipline around all this, the framework in our measurables hierarchy post covers how often to review each layer so the workbook doesn't rot in a folder.
Sample normalized targets by model
These are illustrative ranges to show what realistic, model-specific targets look like — not gospel numbers. Your comparator set should tighten these considerably.
Boutique studio (~2,500 sq ft, 4 trainers, ~320 members)
-
Revenue per square foot
roughly $45–$70/month (high, because space is small and pricing is premium)
-
Revenue per trainer
around $8k–$14k/month
-
ARM including non-dues
about $130–$185
-
Trainer billable utilization
60–75% is healthy; below 50% signals a scheduling or demand problem
24/7 access gym (~9,000 sq ft, 1–2 trainers, ~1,800 members)
-
Revenue per square foot
roughly $9–$16/month
-
ARM
about $35–$55
-
Occupancy cost as % of revenue
keep under ~18%
-
Per-trainer isn't a primary lens here — don't over-index on it
Hybrid facility (~10,000 sq ft, 5 trainers, ~1,100 members)
-
Revenue per square foot
around $14–$24/month
-
ARM including PT and classes
roughly $70–$110
-
Non-dues as % of total revenue
25–40% is a strong signal
-
Trainer utilization
55–70%
Notice how different these are. A 24/7 gym hitting $12/sq ft is doing great; a boutique studio at $12/sq ft is in serious trouble. Same raw number, opposite meaning. That's the entire case for normalization in one comparison.
A real scenario
A small-group strength gym — around 2,800 sq ft, three coaches, about 240 members — came in convinced they had a retention problem because their annual retention (~64%) looked bad against a "75% industry standard" they'd read somewhere.
Running the three lenses told a different story. Per-door revenue was solid for their model band. Per-member contribution margin was actually strong — around $95 ARM with healthy PT attachment. But per-trainer utilization was ugly: coaches were scheduled for far more floor time than they were delivering billable work, sitting near 42% utilization against a realistic 60–70% target for their model.
The "retention problem" was mostly a labor-efficiency problem wearing a retention costume. They weren't losing an unusual number of members for their model — they were paying for coaching hours that produced nothing. After rebuilding the schedule around actual demand windows and tightening how open floor time was assigned, utilization moved into the high 50s over about a quarter, and the payroll drag eased noticeably without touching membership at all. Retention barely moved — because it was never the real issue. The normalized lenses caught what the raw benchmark hid.
Who should skip formal benchmarking
Not every gym needs this yet. If you're pre-launch or under roughly six months old, your numbers are too noisy to normalize meaningfully — you'll be reacting to statistical static. Build clean data collection first, benchmark later.
If you're a single owner-operator running a tiny studio where you personally are the entire labor model and the entire member relationship, the per-trainer lens is basically just "am I busy enough," and a full workbook is overkill. Track ARM and occupancy cost, skip the rest until you add staff or space.
And if your data is genuinely unreliable — active-member counts that don't reconcile, non-dues revenue nobody tracks separately — fix the plumbing before you benchmark. Comparing bad inputs to good comparators just produces confident wrong conclusions, which is worse than no benchmark at all.
Benchmarking fails for small gyms not because the data doesn't exist, but because owners compare raw numbers across models that were never comparable and then set targets they can't logically hit. Normalize first — per-door for space and lease decisions, per-trainer for labor productivity, per-member for real economics. Build a comparator set that shares your model, not just your industry. Express targets as honest ranges in a workbook you'll actually reopen.
The gyms that get real value from benchmarking treat it as a diagnostic, not a scoreboard. When two normalized lenses disagree, that disagreement is the insight — it's pointing straight at your bottleneck. Chase that, not the headline average someone posted in a Facebook group.
Ready to elevate your gym operations?
Join 2,000+ gyms using Gymioly to reduce admin overhead, improve member experience, and grow revenue.