

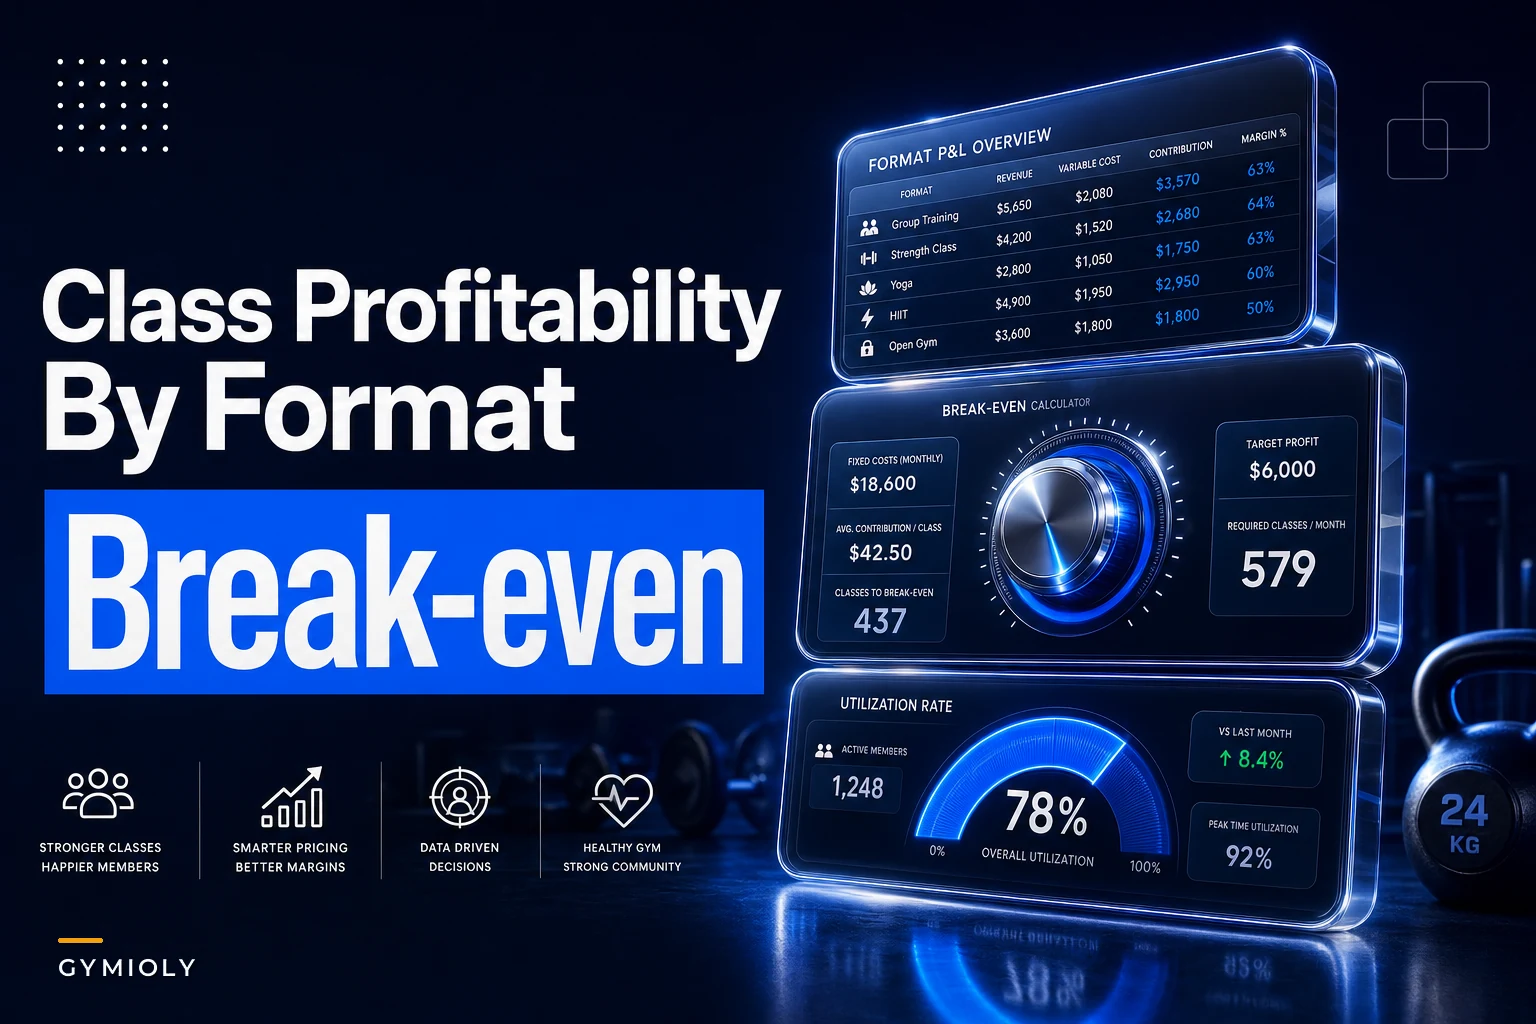

Most gym owners can tell you their total class revenue. Far fewer can tell you what a single Tuesday 6am HIIT class actually nets after trainer pay, floor space, and the opportunity cost of a half-empty room. And almost nobody knows the break-even headcount for drop-in versus a multi-week series versus semi-private slots — which is exactly why so many studios keep running formats that quietly lose money for years.
This is a different problem than capacity planning or series design. You can nail attendance limits and still run an unprofitable schedule if the economics of each format don't hold up. What follows is a way to build per-format micro-P&Ls, work out honest break-even points, apply utilization rules, and use a decision table to figure out what scales and what needs to go.
Why total class revenue hides the losers
Class revenue gets pooled. A studio sees $42k a month across all group classes and feels fine. But inside that number, three or four formats are quietly subsidizing one or two that are bleeding.
Here's where it breaks down in real operations. A drop-in class and a 12-week series both "fill up," so both look healthy on the attendance report. But the drop-in pays a trainer $45 for an hour that brings in six walk-ins at $22 each — gross $132, trainer cost $45, and once you load in the room, front-desk coverage, and processing fees, the margin is thin and the revenue is unpredictable. The 12-week series locks in 14 people at $280 each up front. Completely different animal. Same attendance line, wildly different economics.
This stays hidden because gym software reports on classes by attendance and total sales, not by format-level contribution margin. Nobody's building the micro-P&L, so nobody sees that drop-in is running at a 12% margin while the series runs at 60%.
Build a per-format micro-P&L (the actual line items)
A format micro-P&L is a contribution-margin statement scoped to one format, per session or per cohort. You're not trying to allocate your whole rent and admin overhead — that's a trap that paralyzes the analysis. You want directly attributable costs so you can compare formats on equal footing.
End appointment chaos and boost attendance.
Gymioly streamlines booking, confirms sessions, and manages memberships effortlessly.
- Unified class and membership management
- Automated member notifications
- Trainer scheduling and availability
No credit card required
Per-session (or per-cohort) line items:
-
Revenue — booked revenue attributable to that session. For series/packages, divide the package price across sessions.
-
Instructor cost — flat session rate or per-head rate, plus payroll tax load (roughly 10–12% on top).
-
Variable per-head cost — payment processing (~2.9% + $0.30), towel/consumables, any app or booking fee per transaction.
-
Space opportunity cost — what else that room-hour could earn. This is the line everyone skips, and it's the most important one.
-
Marginal front-desk/support — only if staffing scales with the class. Often $0 for a mid-day class, real cost for a packed evening block.
Here's a worked comparison across four common formats, using a single room-hour as the unit:
| Line item | Drop-in HIIT | 8-week series | Semi-private (4-cap) | PT funnel class |
|---|---|---|---|---|
| Avg paid heads | 7 | 13 | 4 | 9 |
| Price per head (per session) | $22 | $31 | $38 | $0 (free intro) |
| Session revenue | $154 | $403 | $152 | $0 direct |
| Instructor cost (loaded) | $50 | $50 | $55 | $40 |
| Variable per-head | $11 | $9 | $6 | $5 |
| Space opportunity cost | $40 | $40 | $40 | $40 |
| Contribution margin | $53 | $304 | $51 | -$85 direct |
| Margin % of revenue | 34% | 75% | 34% | n/a |
Two things jump out immediately. The series format isn't just "a little better" — it's roughly 5–6x the per-session contribution of drop-in. And the PT funnel class loses money on the session itself, which is fine, because it's not supposed to make money there. It's supposed to convert. More on that below.
The semi-private number here is deliberately modest. In practice the economics of semi-private swing hard on pricing ladders and trainer utilization — if you're running that format seriously, the full breakdown in the semi-private training micro-P&L goes deeper on the per-head math and scheduling grids than what fits here.
Working the break-even for each format
Break-even per session is straightforward once you've built the micro-P&L: how many paid heads cover your attributable cost?
The formula: Break-even heads = (Instructor cost + Space opportunity cost) ÷ (Price per head − Variable per-head)
Run it on the drop-in HIIT above:
-
Fixed-ish cost for the session
$50 + $40 = $90
-
Contribution per head
$22 − $11 = $11
-
Break-even = $90 ÷ $11 ≈ 8.2 heads
That drop-in class needs about 9 paying walk-ins just to cover its own cost. If your average is 7, you're running it at a loss on a per-session basis — even though the class "looks full enough."
Now the series:
-
Fixed cost
$50 + $40 = $90
-
Contribution per head
$31 − $9 = $22
-
Break-even = $90 ÷ $22 ≈ 4.1 heads
The series breaks even at four people. That's the difference a committed, prepaid format makes — the break-even floor drops significantly, which means even a weak cohort is still profitable.
The quiet insight here: formats with high break-even headcounts are fragile. A drop-in that needs 9 heads to break even will dip below the line any time weather, holidays, or a schedule change thins the room. A series that breaks even at 4 is much harder to lose money on. When deciding what to protect in a slow month, protect the low-break-even formats.
Utilization rules that decide scale vs. retire
Break-even tells you about a single session. Utilization tells you whether the format as a whole deserves more slots on the calendar. The rule worth following:
-
Above 1.5x break-even, sustained → scale. Add sessions; this format has demand headroom.
-
1.0x–1.5x break-even → hold and optimize. Profitable but not proven to absorb more supply.
-
0.8x–1.0x break-even → watch. Fix the schedule slot, the instructor, or the marketing before it slips further.
-
Below 0.8x break-even for 6+ weeks → retire or restructure.
The mistake owners make is reacting to a single bad week. One snowy Tuesday doesn't mean retire the format. Six weeks sitting under 0.8x does. Utilization is a trailing signal on purpose — it filters out noise.
If you don't have clean fill-rate data by slot, your attendance history is the raw material. Setting honest limits and reading those patterns is its own exercise — the approach in class capacity planning using historical attendance pairs naturally with this, because you can't benchmark utilization against a capacity number you set by guesswork.
The PT funnel exception — don't benchmark it like the others
PT funnel classes break every rule above, and that's by design. The free or near-free intro class loses money on the session. You benchmark it on downstream conversion value, not session margin.
The micro-P&L for a funnel format looks different:
-
Direct session cost — instructor + space, accept it as a loss (say $85/session from the table above).
-
Conversion rate — what percentage of attendees buy a PT package or paid membership within 30 days.
-
Conversion value — average contract value of what they buy.
A typical example: a funnel class costs $85/session to run and pulls 9 attendees. If 2 of them convert to a PT package worth roughly $600 net over its life, that's $1,200 in downstream value against $85 of session cost. The session P&L is red; the format is profitable.
The break-even question flips entirely. Instead of "how many heads cover the cost," it becomes "what conversion rate makes this worth running?" Here: $85 cost ÷ $600 package value = 0.14, meaning you need roughly a 14% conversion rate on a 9-person class to break even on the format. Below that, the funnel isn't working and you fix the follow-up process, not the class itself.
Classes that are supposed to convert but don't usually have a design problem, not a pricing problem — the structure in why your classes don't keep members is worth reading if your funnel fills but nobody converts.
A decision table for scaling and retiring formats
Pull it together into something you can actually run quarterly. For each format, score three signals: per-session margin, trailing utilization vs. break-even, and strategic role (revenue vs. acquisition).
| Format | Per-session margin | Utilization (6-wk) | Strategic role | Decision |
|---|---|---|---|---|
| 8-week series | High (75%) | 1.8x | Revenue | Scale — add cohorts |
| Semi-private | Moderate (34%) | 1.3x | Revenue + retention | Hold — raise price before adding slots |
| Drop-in HIIT | Thin (34%) | 0.9x | Flexibility/acquisition | Watch — move to peak slot only |
| PT funnel | Negative direct | 18% conversion | Acquisition | Scale — conversion above break-even |
| Mid-day yoga | Negative | 0.6x | None clear | Retire — no margin, no role |
The strategic-role column matters here: a thin-margin format can earn its place if it serves acquisition or schedule flexibility. A thin-margin format that does neither is just a leak. That mid-day yoga slot losing money with no acquisition purpose is the easiest retire decision you'll make — and the one owners avoid for years out of sentimentality.
When retiring a format is the wrong call
A few cases where the numbers say retire but you probably shouldn't:
-
The format anchors a time block. If dropping your 6am drop-in empties the whole early-morning corridor and kills your 7am series too, the drop-in is carrying a schedule, not just itself.
-
It serves a high-value member segment. A barely-break-even format that your highest-LTV members rely on is cheap retention insurance.
-
It's new. Six weeks isn't enough to judge a format you launched two months ago. Give new formats a full quarter before the utilization rule applies.
And one case where owners should retire but hesitate: the "legacy" class that's been on the schedule since you opened, loved by five regulars, losing money every week. Five people's loyalty doesn't justify a permanently red room-hour. Move them into a profitable adjacent format and reclaim the slot.
Real scenario: a two-studio operation cleaning up the schedule
A small group-training studio was running 38 weekly class slots across four formats. Total class revenue looked stable at around $38k–$41k a month, so nothing seemed broken on the surface.
Building format micro-P&Ls changed the picture fast. Drop-in classes — 11 of the 38 slots — were averaging about 6.5 heads against an 8-head break-even. They were running slightly negative most weeks, roughly $300–$450 a month in combined losses, and on top of that, they were sitting in prime peak hours that the series format was already waitlisting into.
The fix was straightforward: retire 6 of the 11 drop-in slots, shift the remaining 5 to genuine off-peak gaps, and convert two freed peak slots into additional series cohorts that had real waitlist demand. No new marketing, no price increases.
Over the next quarter, total class revenue moved to roughly $44k–$46k monthly — not from more members, just from reallocating room-hours toward the format with a lower break-even and higher contribution margin. The schedule got smaller and made more money.
Running this without drowning in spreadsheets
None of this requires fancy tooling to get started. A spreadsheet with the micro-P&L template and a monthly fill-rate pull gets you most of the way there. The friction shows up when you try to run it continuously across every format and slot, because the inputs — attendance, instructor rates, package revenue splits — live in different places and go stale fast.
Keeping this kind of decision table live is where things usually fall apart. The quarterly fire drill happens because pulling the data manually is annoying, so it doesn't get done. AI-assisted operational platforms handle the tedious part — pulling attendance and revenue by format automatically, keeping trailing utilization numbers current, and flagging the format that just slipped under 0.8x before you'd catch it in a manual report.
Here's a simple workflow diagram you can use to automate the core steps.
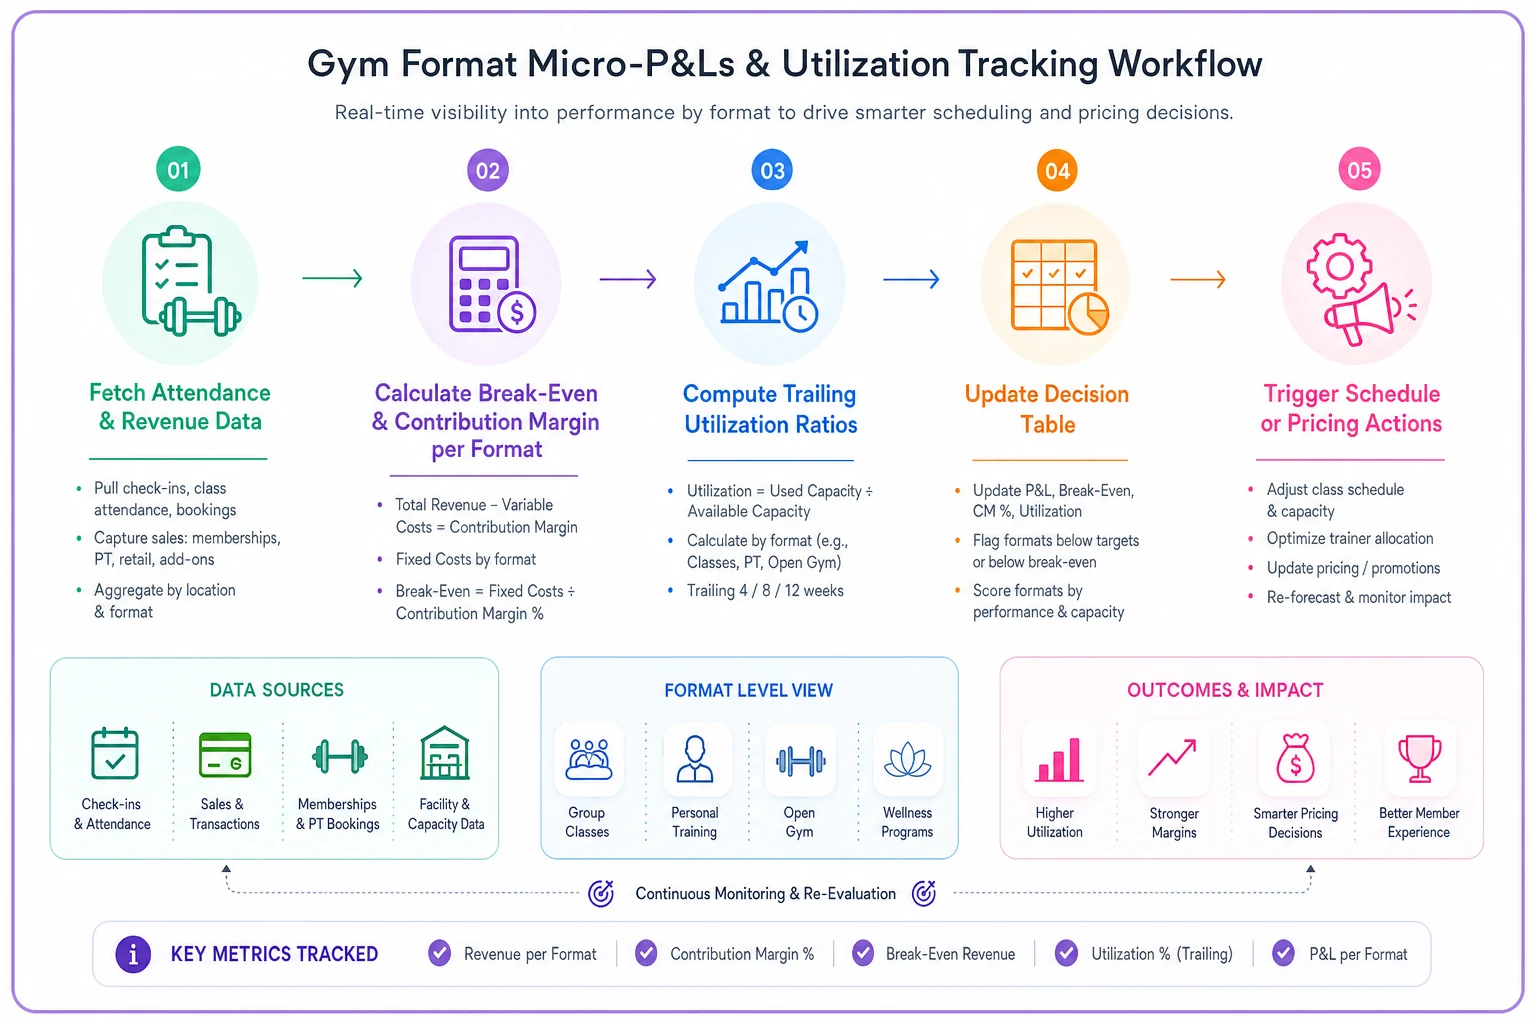
Automate the attendance and revenue pulls first — stale inputs are the biggest practical blocker.
The math doesn't change. You still own the break-even formula and the retire decision. But the inputs stop being stale, which means you're actually looking at the right numbers when it matters.
Where to start this week
Pick your three highest-volume formats and build a per-session micro-P&L for each using the line items above — include space opportunity cost, even if you have to estimate it.
-
Pick your three highest-volume formats and build a per-session micro-P&L for each using the line items above — include space opportunity cost, even if you have to estimate it.
-
Calculate the break-even head count for each with the formula. Note which ones have uncomfortably high break-evens.
-
Pull trailing 6-week average fill rate per format and divide by break-even to get your utilization ratio.
-
Drop each format into the decision table, add the strategic-role column honestly, and circle anything sitting below 0.8x with no acquisition purpose.
-
Retire or relocate one losing slot before the next schedule goes out. Just one. Prove the reallocation works, then do the rest.
The formats you've always run aren't necessarily the formats that deserve the calendar. Benchmark them honestly — per format, against their own break-even — and the schedule starts rebuilding itself around the room-hours that actually pay.
The formats you've always run aren't necessarily the formats that deserve the calendar. Benchmark them honestly — per format, against their own break-even — and the schedule starts rebuilding itself around the room-hours that actually pay.
Ready to elevate your gym operations?
Join 2,000+ gyms using Gymioly to reduce admin overhead, improve member experience, and grow revenue.