



Most gym promotions get judged on the wrong number. Someone runs a "$0 join fee, first month half off" campaign, sees 60 new signups in three weeks, and calls it a win. Nobody goes back six months later to check how many of those 60 were still paying. When they finally do, the answer is usually somewhere between ugly and quietly devastating.
The problem isn't running promotions. It's running them without a way to separate "brought in members who stay" from "brought in tourists who churn out and leave you worse off than before." A discounted cohort that quits at month three can cost you more in wasted onboarding labor, equipment wear, and staff attention than the revenue they ever contributed.
This is about building a gym promotion experiment template that answers one question cleanly: does this offer create durable members, or just a spike? You test on a slice, measure retention at 30 and 90 days against a control, account for real costs, and set a cutoff before you look at the data so you can't talk yourself into scaling a loser.
Why gyms keep scaling promotions that quietly lose money
The core mistake is measuring acquisition and ignoring what happens after. New signups are visible, satisfying, easy to count. Churn from a specific cohort is invisible unless you deliberately tag and track it.
The pattern usually looks like this. A gym runs an aggressive discount, the front desk gets busy, the owner feels momentum. The discounted members who signed up impulsively behave exactly like impulse buyers — they come twice, lose interest, and cancel the second the discount period ends or the first full-price payment hits their card. Meanwhile the gym has already:
-
paid staff to onboard them
-
issued access fobs or app credentials
-
absorbed merchant fees on the discounted transactions
-
crowded classes that annoyed longer-term members
And because nobody tagged that cohort, the churn just blends into the general monthly attrition number. The promotion looks fine on the surface. You run it again next quarter. You're now systematically importing churn.
The second mistake is comparing a promoted group to nothing. "We got 60 signups" means nothing without knowing what you'd have gotten anyway. January signups are high regardless of what you do. Comparing a January promo to a normal month and crediting the promo for the whole difference is how gyms convince themselves seasonal traffic is a marketing genius move.
The structure of a promotion experiment that actually tells you something
You need three things: a control group, cohort tagging, and a retention measurement window that extends past the discount period. Miss any one and the test is basically decorative.
End appointment chaos and boost attendance.
Gymioly streamlines booking, confirms sessions, and manages memberships effortlessly.
- Unified class and membership management
- Automated member notifications
- Trainer scheduling and availability
No credit card required
Control group. You don't have to withhold the offer from half your prospects and feel guilty about it. The cleanest control for most single-site gyms is a time-matched or segment-matched group — prospects from the same source and season who came through your normal full-price funnel. If you're running paid ads, you can also split the audience so half see the promo landing page and half see standard pricing.
Cohort tagging. Every member who enters through the promotion gets a permanent tag in your member system. Not a note in someone's head — a field you can filter and export. This is the single most skipped step and the one that makes everything else possible. If you can't pull "everyone who joined via Promo X" in ten seconds, you can't run this at all.
Retention window. Measure at 30 days (did they survive the honeymoon) and 90 days (did they survive the first full-price cycle). For most memberships the 90-day mark is where discount tourists reveal themselves, because that's usually when promo pricing lapses and the real charge hits.
A simple cohort A/B template
Here's the skeleton you fill in before you launch anything. Keep it to one page.
| Field | Example entry |
|---|---|
| Promotion name / tag | SEP-halfmonth-2024 |
| Offer mechanics | 50% off first month, no join fee |
| Test group source | Instagram + walk-ins, Sept 1–21 |
| Control group | Full-price joins, same sources, Sept 1–21 |
| Target sample size | 40 promo / 40 control minimum |
| Primary metric | 90-day retention rate |
| Secondary metrics | 30-day retention, avg visits/wk wk1–4, downgrade rate |
| Decision cutoff | Promo 90-day retention must be ≥ 80% of control's |
| Accounting adjustment | Subtract discount + onboarding cost per member |
| Decision date | Dec 22 (90 days after last signup) |
The two fields people consistently leave blank are decision cutoff and decision date. Those are exactly the two that prevent rationalization. Write them down before you have any data and you can't move the goalposts later.
Building the retention‑impact table (30/90-day)
Once the window closes, the whole analysis fits in one table. The point is to compare cohorts side by side, not to admire the raw signup count.
| Metric | Control (full price) | Promo cohort | Verdict |
|---|---|---|---|
| Members entered | 38 | 44 | — |
| 30-day retained | 34 (89%) | 39 (89%) | Even |
| 90-day retained | 30 (79%) | 25 (57%) | Promo worse |
| Avg visits/wk (wk 1–4) | 2.6 | 1.9 | Promo lower engagement |
| Downgraded/froze by day 90 | 3 | 9 | Promo shakier |
Read this table the way it deserves. The promo looked fine early — same 30-day retention, more bodies through the door. By day 90 it collapsed to 57% versus the control's 79%. The lower weekly visit count during the first month was the early warning sign: these members never really engaged, they just took the deal. If you'd judged on the 30-day number or on signup volume alone, you'd have scaled a cohort that leaks by month three.
That gap between 30-day and 90-day retention is the most useful signal in the whole exercise. When a promo cohort holds at 30 but craters at 90, you've bought attention, not commitment. When it holds at both, you've probably found something worth keeping.
Accounting adjustments most gyms forget
A retention comparison isn't complete until you convert it to money, and that means subtracting the real cost of the discount cohort — not just the face value of the discount.
Per-member cost of a promo signup usually includes:
-
The discount itself — obvious, but easy to forget to sum across the whole cohort
-
Onboarding labor — front desk time, orientation, app setup, roughly 30–45 minutes of staff time per new member
-
Merchant and admin fees on the discounted transactions
-
Servicing cost during their short life — access, cleaning, class capacity they consumed
Say your promo gave up around $35 per member in first-month discount, plus roughly $12–15 in onboarding labor. On 44 members that's somewhere around $2,100 spent to acquire the cohort. If only 25 survive to day 90 and their contribution margin is $45/month, you can run the math on whether the survivors ever pay back the cost of the whole group — including the 19 who churned.
The uncomfortable version: sometimes a promo acquires more members and still loses money because the churned members' onboarding cost isn't covered by the survivors' contribution. A full-price cohort with fewer signups but 79% retention frequently wins on actual profit. This is the same discipline that surfaces in fixing pricing mistakes that cost gyms revenue — the headline number and the profitable number are rarely the same thing.
Decision cutoffs: the rule you set before you look
The cutoff is a single sentence written before launch: "We scale this promo only if the promo cohort's 90-day retention is at least 80% of the control cohort's, and the adjusted per-member profit is positive."
Two conditions, both gates. Both have to pass. The "written in advance" part matters because after you launch, you'll be emotionally invested. You'll have told staff about it. You'll want it to work. If you decide the cutoff after seeing 57% retention, you'll find a reason 57% is "actually fine for our market." Pre-commit and you remove yourself from the decision.
-
Scale — promo retention ≥ 80% of control AND adjusted profit positive
-
Refine and re-test — retention 65–80% of control (something's there, but the offer or the onboarding is leaking)
-
Kill — retention < 65% of control OR adjusted profit negative
The middle tier is where the real learning happens. A cohort that retains at 70% of control isn't a failure — it's usually an onboarding problem, not an offer problem. The people showed up; something in the first two weeks didn't stick. That's fixable without touching the discount structure.
A workflow for running one clean test
PROMOTION EXPERIMENT WORKFLOW
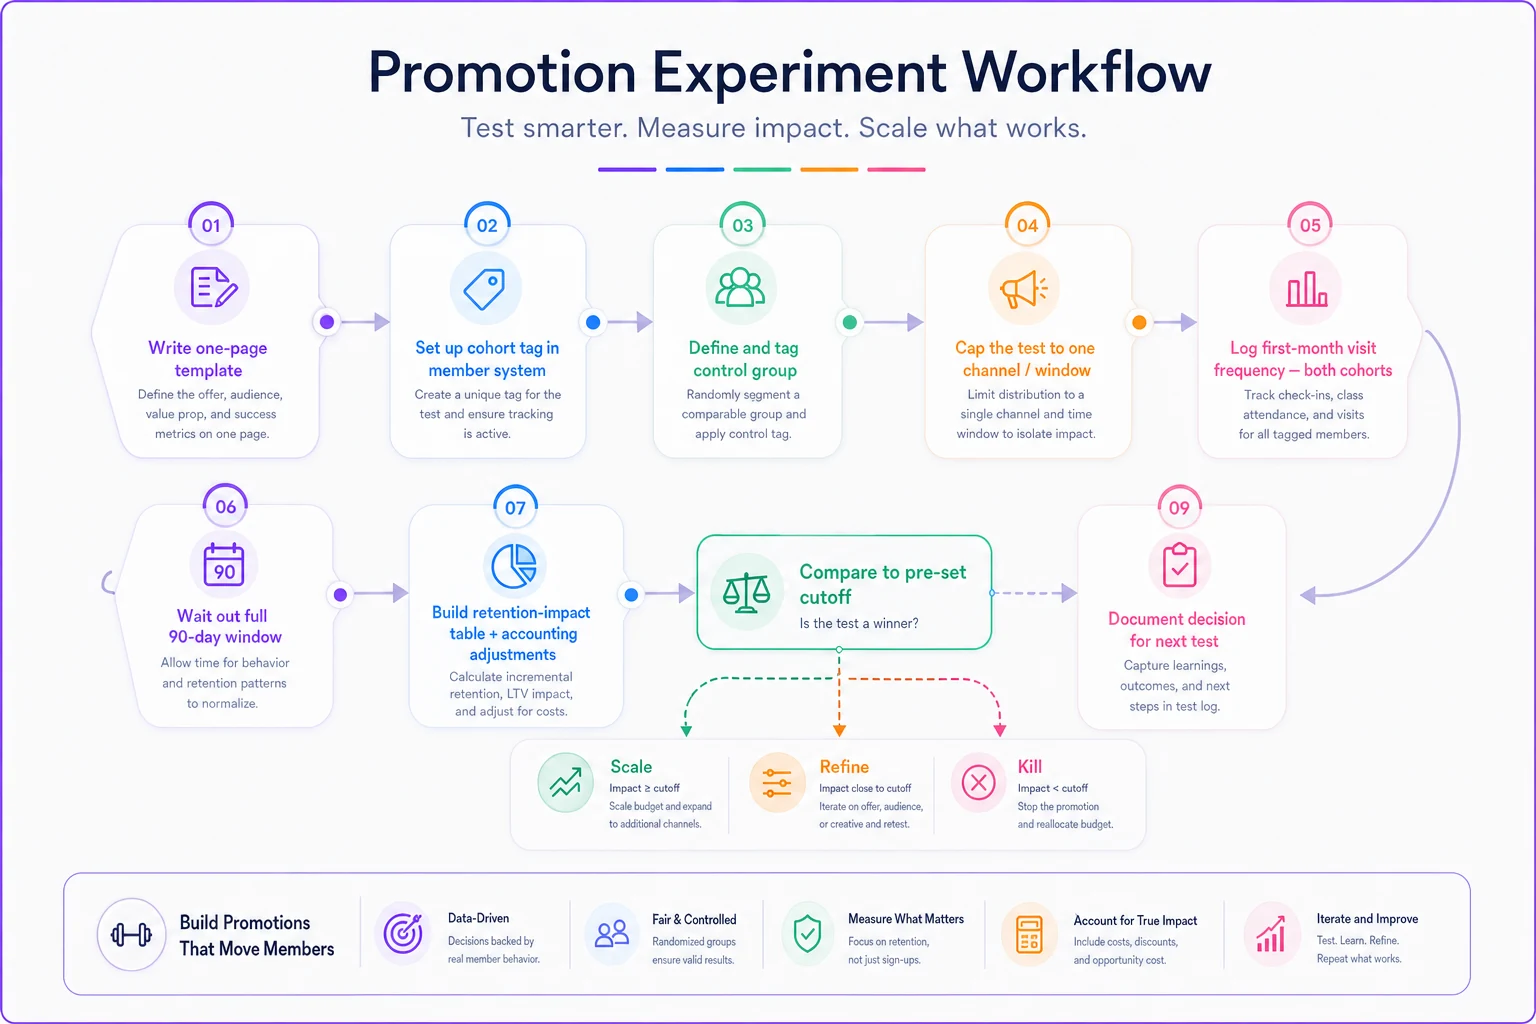
The operational sequence matters less than the discipline to actually follow it. Don't launch without the cutoff filled in. Don't peek and act early at day 20. And document your reasoning after the call — because next quarter's test should build on what this one taught you, not start from scratch.
-
[Write one-page template]
-
[Set up cohort tag in member system]
-
[Define and tag control group]
-
[Cap the test to one channel / window]
-
[Log first-month visit frequency — both cohorts]
-
[Wait out full 90-day window]
-
[Build retention-impact table + accounting adjustments]
-
[Compare to pre-set cutoff → Scale / Refine / Kill]
-
[Document decision for next test]
The waiting is genuinely the hard part. Owners want to declare victory at day 20. The entire value of this method is refusing to.
Where software quietly does the heavy lifting
None of this requires anything fancy, but it does require your data to be tagged, filterable, and consistent — which is exactly where manual tracking falls apart. Cohort tags scribbled in notes, retention counted by hand, spreadsheets that don't match the billing system: that's how tests get abandoned halfway through.
An operational platform with proper member tagging, automated cohort tracking, and retention reporting removes the friction that kills these experiments. When the system can auto-tag a promo cohort, track visit frequency, flag early drop-offs, and pull a clean 90-day retention comparison without anyone building a spreadsheet, running experiments stops being a project and becomes routine.
The measurement discipline matters more than the tool — but the tool is what makes the discipline survive a busy month.
When this is worth it — and when it isn't
Run structured promotion tests when: you run promos more than once or twice a year, you have enough monthly signups to get 40+ per cohort in a reasonable window, and you're about to make a bigger discount decision than usual. The cost of scaling a bad promo across your whole funnel is exactly what this prevents.
Skip the formal version when: you're small and get a handful of signups a month — you won't reach a sample size that means anything. You're better off just watching 90-day retention on every new member. Also skip it for one-off community events that aren't designed to convert to memberships.
Who should not do this: anyone who isn't willing to honor the cutoff. If you're going to scale the promo regardless of what the data says, don't waste the effort measuring — just run it and accept you're guessing. The test only has value if you're prepared to kill something that felt successful.
Real scenario
A single-location strength gym ran a recurring "join for $1, first month" promo every quarter, averaging around 50 signups per run. It felt like their best acquisition channel. When they finally tagged a cohort and tracked it against full-price joins over the same window, the promo group's 90-day retention came in around 55% versus roughly 78% for full-price members. First-month visit frequency was noticeably lower for the promo group — under two visits a week on average.
After adjusting for the discount and onboarding cost across all 50 signups, the promo cohort barely broke even, and only because a handful of survivors stuck around long enough. They didn't kill the offer outright — they moved it to the refine tier, added a two-week onboarding touchpoint sequence specifically for promo members, and re-tested. The next cohort's 90-day retention landed closer to 68%. Same offer, better onboarding, materially better economics.
Without the tagged comparison, they'd have kept running the original version indefinitely, importing churn every quarter and congratulating themselves on the signup count.
The takeaway Promotions aren't the problem. Judging them on the wrong number is. A signup spike tells you an offer was attractive; it tells you nothing about whether it built a business. The gap between 30-day and 90-day retention, measured against a real control and adjusted for what the cohort actually cost you, is where the truth lives. Set the cutoff before you launch. Tag the cohort. Wait out the window. Compare to a control. Then let the number — not the momentum, not the busy front desk — decide whether it scales. Tighten the surrounding mechanics too, from how your intro offers are structured to how you run referral incentives, and you stop guessing about acquisition entirely and start building offers you can actually defend with data.
Ready to elevate your gym operations?
Join 2,000+ gyms using Gymioly to reduce admin overhead, improve member experience, and grow revenue.